Dear Reader,
You’re already on the path to becoming a true trading pro…
But there’s something I haven’t shared with you yet.
And I’m confident it’s something you’ve never seen before.
In fact, you may have a hard time believing it’s actually real.
You see, in the next few moments I’m going to reveal to you a very simple, very proven and yet very HIDDEN pattern that can position you to…
Only buy stocks that are trending UP in value!
All it takes is for you to recognize “the Pattern” that I estimate only around 1% of investors can see.
It looks like this… X
Yes, just a boring old X.
But when you’re able to see it on a stock chart… it becomes a lot less boring.
I’ll show you… take a look at this chart for Advanced Micro Devices (AMD), a $63 billion company that develops computer processors.
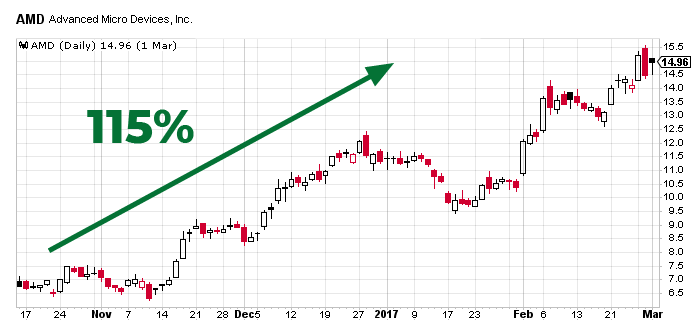
You’ll see that around November 14, AMD’s share price began to inch up.
And then a couple weeks later it skyrocketed!
It rose a bit early in the month, then turned downwards for a week or so.
And I realize this all sounds super simplified. And it is.
Notice I haven’t mentioned anything about why AMD’s share price took off.
Nor have I mentioned any sales figures, earnings reports, news reports… any of it.
Because NONE of that stuff matters.
Not when you’ve identified the Pattern.
The big flashing X that tells you exactly when to buy and exactly when to sell.
Take a look at the AMD chart again. And this time you’ll see that the ONLY things that matter are two dates.
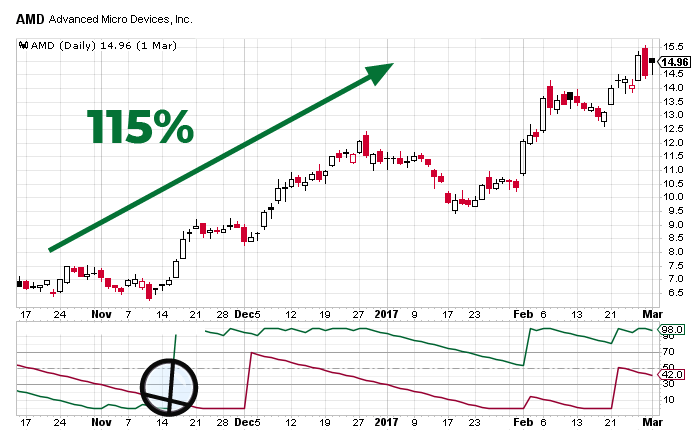
Check out what happens around November 14.
There you’ll see the X that I’m talking about.
The green line shoots WAY up… and the red line is plummeting down.
They intersect, form an X… and now we have our pattern.
And following that first X, AMD’s stock ends up soaring up 115%!
In other words, if you can identify this one simple pattern…
You have the ability to bag easy triple-digit gains as you just saw above.
And this happens time and time again…
Like it did with Ever Quote (EVER).
It’s an online insurance company and at one time was trading for just around $7 per share.
But as you’ll see on the chart below, the share price suddenly exploded.
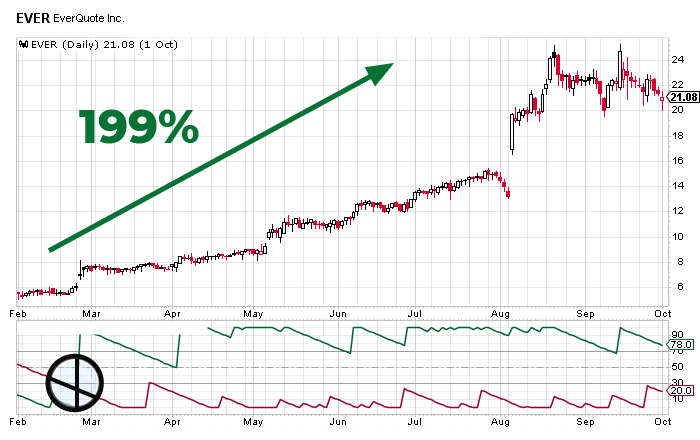
Just as March was hitting, the X appears with the green line shooting up and the red line dropping down and crossing over.
That began a prolonged price climb for EverQuote that took place over the course of eight months and pushed shares all the way up to $21.
Why did EverQuote’s share price spike so high over that year?
Who cares!?
IT DOES NOT MATTER.
The only thing that matters is when the X appears.
That’s it.
Here’s a chart from Tesla (TSLA)
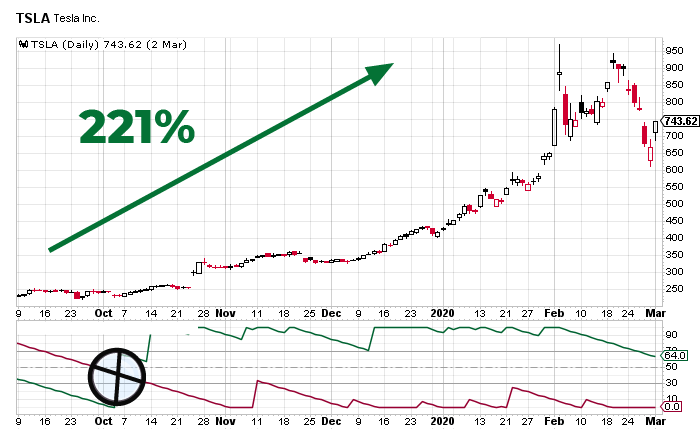
See the X? It appeared in October of 2019.
The green light shoots up, right across the falling red line.
Following that, Tesla lights up like a firecracker!
Their shares were trading at the start for around $231.
By February of 2020, the stock had hit $743 and paid out an incredible return of 221%!
Being able to identify this pattern is like having an alarm set that tells you exactly when to buy and exactly when to sell a stock at the precise right time.
And its reliability places you in prime position to only add stocks to your portfolio that are trending up at your time of purchase. When you see the X for the first time, you simply buy shares of the company it’s appearing in.
Then when the X appears a second time… sometimes that’s in a few weeks, sometimes it’s a year later… you simply sell those shares and cash out with your profits.
That’s it.
There’s no complicated exotic investment vehicles you have to get a special accreditation to buy.
No options or bonds or overseas exchanges to worry about.
Just basic, run of the mill stocks and two actions to take.
Buy… and sell.
And the Pattern tells you exactly when to do both.
The three examples I’ve just shown you are only a fraction of the opportunities you could have taken advantage of over the last 5 years.
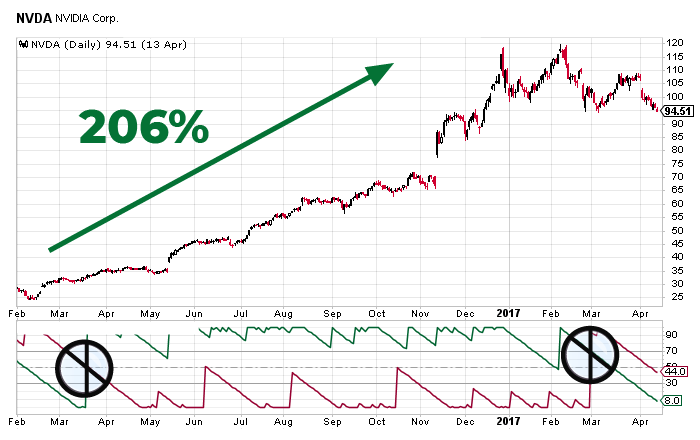
There were also some huge gains on Nvidia, the computer game company:
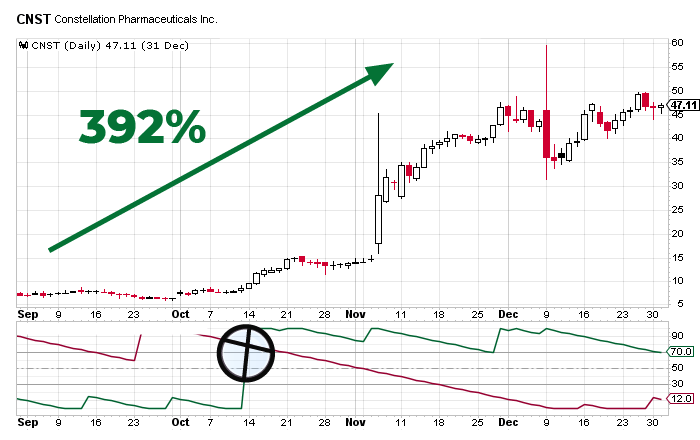
And then again on Constellation Pharmaceuticals…
The possibilities are nearly endless once you can identify the single pattern I’ve been telling you about.
With this pattern alone, you could have banked crazy gains like the following:
Through my extensive research of the Pattern I’ve seen gains of…
820%
578%
562%
526%
513%
439%
408%
406%
386%
295%
288%
216%
213%
210%
194%
181%
170%
And many many more…
And I’m Handing You the Keys
to Gains Like These RIGHT NOW
I want you to have THE best opportunity to become a successful trader.
So I’ve decided to do something very special.
In short, I’m inviting you to access our Explosive Chart Patterns advisory service.